


April 15th, the IRS’ tax filling deadline, is right around the corner regardless of whether or not you straight up love taxation. With the looming government-sponsored-khaki-bag-with-a-superimposed-$-on-it (©Wondergressive 2013), one cannot help but wonder what all of our money is spent on? Or better yet: Where does the United States’ government say that it goes?
Lets begin, continue, finish, and be confused with the numbers. As 2013 taxes have yet to be collected, I’ll be examining the collected tax statistics for 2011. From the 2011 IRS Data Book:
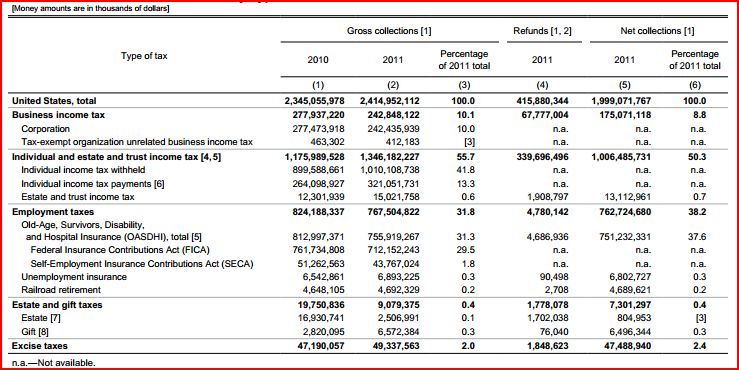
So after tax collections and refunds, the US government scored a wicked haul just over $2.4 trillion. Sounds like a lot of money? Well that is primarily allocated to the fact that that it is a lot of money. You could buy so many flapjacks with $2.4 trillion, it is ridiculous. Unfortunately, there has been no fiscal policy, to date, which allows for such lumberjackian-breakfast style accommodations(©Wondergressive 2013).
Aside from selling treasury shares which collect huge amounts of interest, tax revenues are the only way in which our government gets money. So every paycheck you give money to the government in exchange for a service. Do you like the results that you’re getting?
Now that we know how much money the great tax vacuum inhales every year lets examine the federal budget spending (outlays in billions of dollars) for that same year:
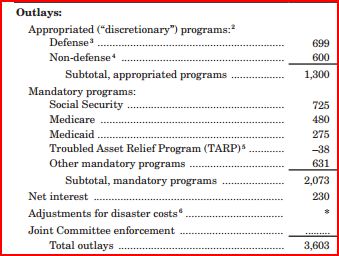
As you can see, the majority of spending is divided between discretionary programs and mandatory programs. Social security, medicare, medicaid, and other programs received approximately $2 trillion dollars in government spending. Great, we’ve got around $400 billion left! Lets spend it on some cool stuff that will make us all happier.
Right away we’ve got a problem: The defense budget is allocated almost $700 billion. That’s 30% of 2011 total collected tax revenue.
The non defense budget consists of another $600 billion dollars. According to an article from americanprogress.org, nondefense discretionary programs include…
…nearly all of the federal government’s investments in primary and secondary education, in transportation infrastructure, and in scientific, technological, and health care research and development. It also includes nearly all of the federal government’s law enforcement resources, as well as essentially all federal efforts to keep our air, water, food, pharmaceuticals, consumer products, workplaces, highways, airports, coasts, and borders safe. It includes veterans’ health care services and some nutritional, housing, and child care assistance to low-income families. It even includes the funding for such national treasures as the Smithsonian Institution, our national parks system, and the National Aeronautics and Space Administration, better known as NASA.
In lay speak that means: all of the neat stuff.
Next on the list comes the net interest. $230 billion dollars of interest was accrued by previous treasury bonds. In the unlikely case that you are completely unaware of debt and its practice; interest accrued is a compounding tax on borrowed money. It acts as incentive for borrowers, giving them a payout for “helping” a country in need. As the U.S. general public holds $11,855,687,948,374.48 in debt, I’ll spare you any more ironic explanations of debt.
Wait a second. Wait just one second. In 2011 the U.S. Government spent approximately $3.6 trillion. The tax revenue accounts for approximately 67% of that money spent. So, as I stated earlier, the other 32% must come from treasury shares. That means that almost a third of our 2011 spending was covered by a pseudo-credit card.
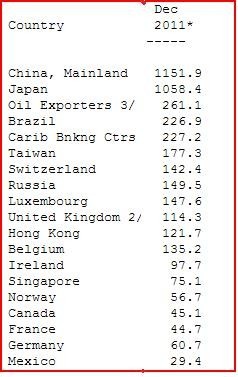
So who all helped finance our deficit? The chart to the left shows the amount of money, in billions of dollars, that the united states owes to various countries and companies.
China and Japan rake in the most with a combined $2.1 trillion. To put that into perspective that’s almost the entire collected tax revenue for 2011. An entire year of hardworking laborers would just barely be able to pay off these two debts. This is assuming that the United States spends absolutely nothing on anything else.
So, when you hear about congress and the president running around every year trying to figure out a budget, you now have a better understanding of what the heck they are actually doing. Every person has a different idea of what the United States budget should be and when there are outside interests holding gigantic stakes there is absolutely no easy way to get out of this.
The best way to fix anything is to start small. A billion dollars here a billion dollars there. It might be an idea to start turning off the white house bowling alley an hour earlier each night.
Sources:
Treasury Securities
Nondefense Discretionary Programs
National Public Debt
2011 IRS Data Book
2011 Budget Summary Tables
Related From Wondergressive:
Open Access Journals Suddenly Open to the Public
ObamaCare and the 49-Employee Company
